The last blog introduced this blog series on communal area development in Zimbabwe, and the comparisons with resettlement areas. This week’s blog continues the series with a look at the distribution of assets people have and their importance in building livelihoods.
Our four communal area sites across Masvingo province each have highly differentiated populations. We undertook a ‘success ranking’ in each, where local informants allocated each of the 608 households in our sample to a group (doing well, doing OK and failing), and explained the reasons behind their choice. In each case there was a majority in the bottom two categories, with relatively few in the top success group.
What were the criteria they used? These varied between sites. In the dryland areas of the Lowveld, cattle ownership was the key, alongside off-farm work, reflecting the importance of migration to South Africa in household economies. In the Gutu sites, crop production became more of an indicator, alongside remittances and formal jobs. In all sites ‘a good home’ (usually meaning a brick house, with a tin roof) was an important criterion.
What then are the characteristics of the households in our four sites? The table below offers some basic information.
| Mwenezi | Chivi | Gutu West | Gutu North | |
| Sample size (N) | 150 | 251 | 97 | 110 |
| Since 2011, % left and abandoned farms | 6.3 | 13.4 | 14.9 | 9.8 |
| Average household size | 8.0 (4 under 16) | 6.2 (3.1 under 16) | 6 (2.3) | 6.1 (2.3) |
| Female headed households (%) | 23 | 27 | 36 | 34 |
| Households w members who went to resettlement areas post 2000 (%) | 11.3 | 1.9 | 3.1 | 3.6 |
| Households with someone working elsewhere | 55 | 25 | 45 | 21 |
| Households with children aged 21-30 working elsewhere | 63% (half in SA) | 27% (inc. 13 working abroad) | 27% (only 5 away from area) | 41 (8 away, mostly SA) |
| Lead women in household with access to land (%) | 48 | 43 | 48 | 21 |
| Average age of household head | 41-50 | 41-50 | 41-50 | 41-50 |
| Household heads attending school above Form 2 (%) | 29 | 26 | 32 | 37 |
| Master Famer certificate (%) | 14 | 13 | 27 | 26 |
Since our original studies, there has been a turnover in households, with 11.2% of our cases (N=77) from our original sample of 685 households having left over six years, with no one replacing them. Various reasons for exit were recorded. In rank order these were: death, moving to live in town, moving to other communal areas, moving to South Africa, abandonment and moving to a resettlement area. Ageing communal area populations are not necessarily being replaced on death, as the younger generation does not take up the homestead or plot, and the land remains abandoned. Due to old age, some parents, especially if one has passed on, will go and live with children in town or the new resettlements. Younger inhabitants may also abandon plots too, finding better alternatives, for example with work in South Africa or in town, or through the allocation of a resettlement plot. The highest rate of exit was seen in Gutu West, followed by Chivi, Gutu North and Mwenezi. In Mwenezi, some maintain two homes and fields in the communal and resettlement areas, which is reflected in a lower exit rate.
For those remaining, the data show a pattern evident in many communal areas. Household heads have a mix of ages, with an average in the mid-late 40s. Quite a few household heads have passed on since we last visited in 2011-12; although some farms have been abandoned, others have been replaced by younger people through inheritance or reallocation. 23-36% of the households are recorded as female-headed, where husbands have died or are absent for long periods. Outside Gutu North, where land is especially constrained, 43-48% of women, either because they are in charge or through the marriage contract, have access to their own land.
As is the case throughout Zimbabwe, and especially for those who benefited from the post-1980 educational provision, schooling is on average quite advanced, more so in the mission influenced areas such as Gutu, where 32-37% of household heads attended secondary school. Master Farmer certificates are indicators or engagement with agricultural extension training provided by the state, particularly in the past, and 13-27% of households have a certificate, with more in the higher potential Gutu areas. As discussed in a later blog in this series, engagement with projects – by NGOs or donors or the state – is patchy, with intensive activity in some areas, but almost complete absence elsewhere. These data show that external interventions overall are limited, and very few people indeed benefited from the Presidential inputs scheme or ‘command agriculture’ in this period.
Asset poor, but differentiation

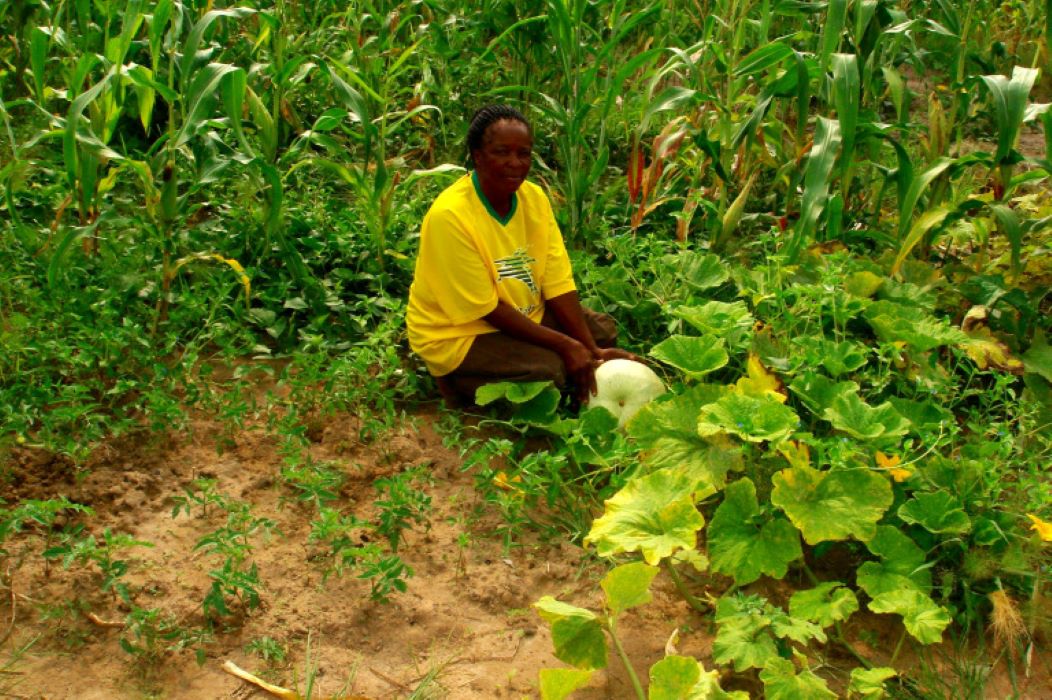
Across our communal area sites in Masvingo province, there is a broad similarity in average levels of average household asset ownership, as the table below shows. Not surprisingly, livestock ownership is highest in the drier areas, as is investment in well digging. Within the sites there are large variations, with asset ownership patterns being highly correlated with the success ranks discussed above. Some assets are widely owned, such as a brick house with a tin roof, as well as ploughs, cell phones and bicycles. Others differentiate the group more, including cattle, tractor and car ownership.
| Mwenezi | Chivi | Gutu West | Gutu North | |
| Land owned (ha) | 6.5 | 2.1 | 1.6 | 1.4 |
| % households dug well in last 5 years | 14 | 2 | 2 | 8 |
| Cattle owned (nos) | 7.6 | 4.0 | 3.1 | 3.7 |
| Households with brick/tin roof house (%) | 89 | 80 | 69 | 86 |
| Plough ownership (%) | 52 | 45 | 30 | 37 |
| Harrows (%) | 10 | 34 | 22 | 65 |
| Cultivators | 12 | 23 | 26 | 16 |
| Cart ownership (%) | 50 | 21 | 10 | 24 |
| Wheelbarrow owned | 41 | 50 | 21 | 25 |
| Car ownership (%) | 13 | 5 | 10 | 8 |
| Tractor ownership (%) | 13 | 0 | 0 | 0 |
| Bicycle ownership (%) | 45 | 32 | 36 | 43 |
| Solar panel ownership (%) | 75 | 57 | 69 | 47 |
| Cell phone ownership (%) | 87 | 92 | 89 | 91 |
| TVs owned (%) | 23 | 25 | 44 | 30 |
| Pumps owned (%) | 5 | 1 | 2 | 2 |
| Spray equipment owned (%) | 22 | 35 | 21 | 15 |
Levels of asset ownership are lower on average in the communal areas compared to the nearby A1 schemes, although there are exceptions in both directions. The key difference of course in the A1 schemes is land ownership, where households cultivate 4.0-6.6 ha of land in the sites nearby, and there is much more extensive grazing. This is associated with accumulation from crop and livestock production and so investment in other productive and service assets. Again, this is not universal, but whereas perhaps 5-10% of households in the communal areas (the top of our success group 1) are able to accumulate from local production, this increases to 30-40% in the A1 areas next door.
People’s capacities are broadly similar (A1 resettlement area populations are on average slightly younger and a bit more educated), but it’s access to assets that make the difference. Land redistribution in particular has made a big difference for many. While in the communal areas there is a long tail of asset and income poor households in need of external support, through remittances, off-farm work and state/donor aid, with only a few able to accumulate through farm-based production, in the A1 resettlements this pattern is reversed and there is much more development potential driven by ‘accumulation from below’ for at least a third of households. For them, a positive upward cycle is generated, as agricultural surpluses allow reinvestment in productive assets, and so potentials for greater accumulation, while others aspire to create such opportunities.
As discussed in later blogs, this has important implications for rural development options, with investment in productive, agriculture-based development possible in the resettlements (focused on ‘stepping up’ livelihoods), but much less so in the communal areas, where a focus on exit to non-farm livelihoods (‘stepping out’) and social protection (‘hanging in’) must dominate.
This post is the second in a series of nine and was written by Ian Scoones and first appeared on Zimbabweland.
This field research was led by Felix Murimbarimba and Jacob Mahenehene. Data entry was undertaken by Tafadzwa Mavedzenge
Lead photo credit: Tapiwa Chatikobo