Influence of rice commercialisation on poverty reduction levels in Kilombero Valley, Tanzania
Written by: Aida Isinika and Ntengua Mdoe
The commercialisation of smallholder agriculture has been considered a key strategy for sustainably reducing poverty and achieving equitable growth across many countries in sub-Saharan Africa. In Tanzania, linking farmers to markets is pursued as an important strategy towards commercialisation and agricultural transformation under the National Development Programme and current Five-year Development Plan for the period 2016 – 2021 and the national vision up to 2025. This blog examines changes in rice commercialisation and poverty levels of different farmer categories that have occurred between 2017 and 2019, as presented in APRA Working Paper 63, based on the findings from Mngeta division, Kilombero Valley in Morogoro region, Tanzania, where rice is the most important food and cash crop.
Rice commercialisation, measured by the Rice Commercialisation Index (RCI) is defined as the share of paddy/rice harvested from the total volume harvested. Poverty was measured by the multi-poverty index (MPI). Policy recommendations are made to improve rice value chain performance in the study area. Agricultural commercialisation is associated with higher use of productivity-increasing inputs, which lead to crop intensification as well as increasing usage of inputs such as tillage implements, which lead to area expansion or extensification. In the context of this study the inputs included purchased seed, inorganic fertiliser, farmyard manure, agrochemicals (pesticides and herbicides), implements and hired labour.
Study findings
According to the findings, there is a decline in the land available per household for farming, including rice production (Figure 1a). Farmers have responded by using higher proportions of all inputs except purchased seed and farmyard manure. The positive trend in inputs usage is consistent with increasing agricultural intensification, while increasing use of tillage services and hired labour corresponds to extensification (Figures 1b and 1c). Both intensification and extensification have been associated with rising commercialisation. The largest increase occurred in the use of herbicides where 11.2 per cent more households used the input in 2019 relative to 2017, compared to only 2.4 percent for inorganic fertiliser. Meanwhile, the decline of households using purchased seed and farmyard manure was associated with their limited availability. The use of services (tillage, extension and mobile money) also improved by at least 5.6 per cent (Figure 1).
Figure 1. Sample mean values for use of inputs and services
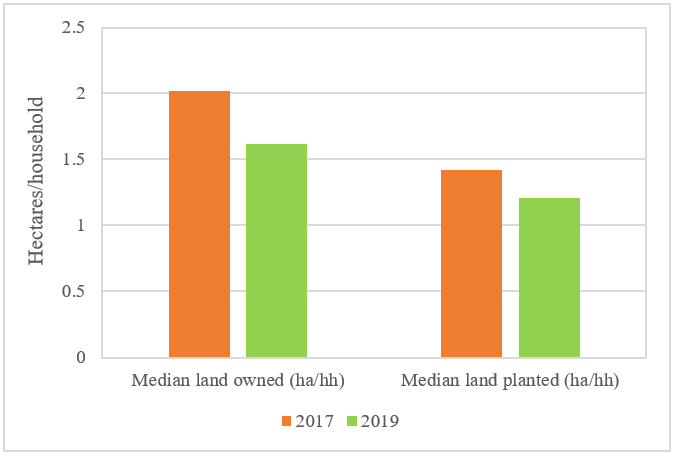
(a) Median land owned and planted 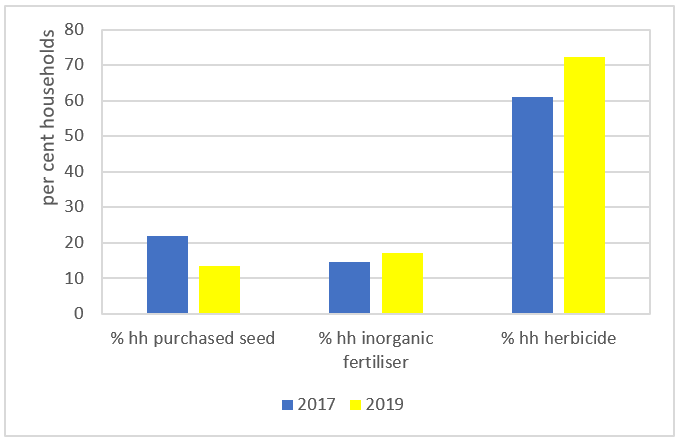
(b) Per cent households using input 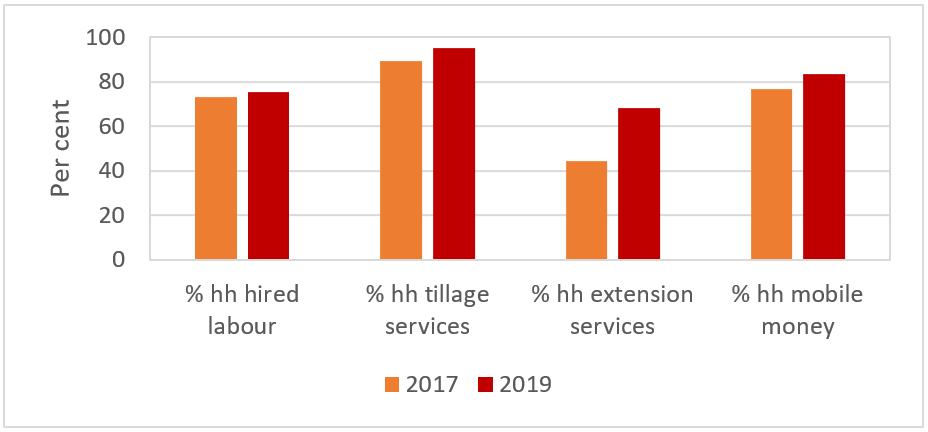
(c) Per cent households using service
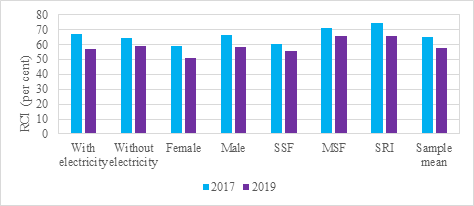
The combined effect of the changes in input usage brought significant to marginal decline in yield across all farmer categories, except among medium-scale farmers whose yield increased by 13.3 per cent for the whole sample (Figure 2). This also led to a decline in the mean volume of paddy harvested and the volume sold, resulting a decline in the RCI across all farmer categories (Figure 3), being influenced by many positive (schooling, land owned, input use) and negative (household size, age and gender of household head and distance from nearest large rice mill) factors.
Figure 2. Changes in paddy median yield by farmer category
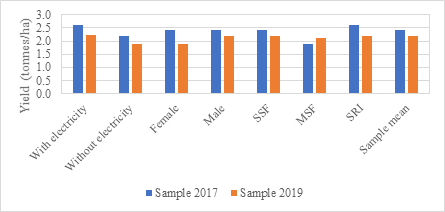
Figure 3. Changes in median RCI by farmer categories
Nonetheless, the livelihood outcomes measured by the MPI showed a significant decline in poverty, representing livelihood improvement, both in terms of the MPI score and the decline in the number of MPI poor households (Figure 4). While the RCI had a poverty-reducing effect, this effect was only significant at higher RCI levels (fifth quintile). This implies that there are other economic activities in the study area which contributed to poverty reduction or livelihood improvement.
Figure 4. Changes in the MPI score and MPI poor households
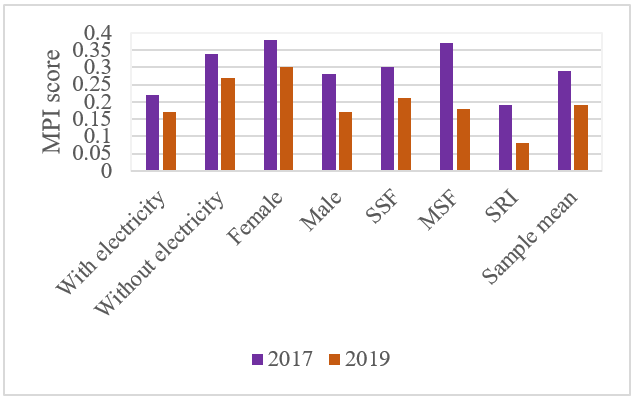
(a) MPI score 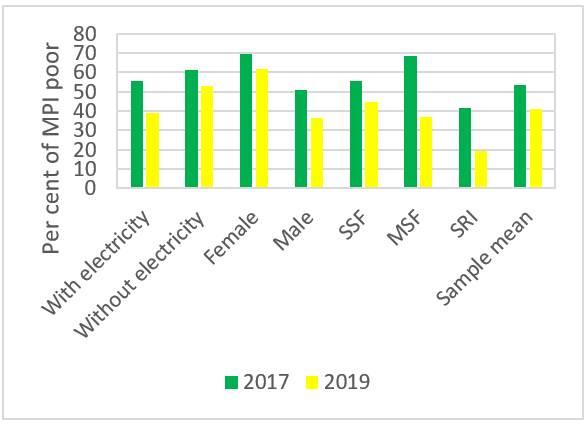
(b) Per cent of MPI poor households
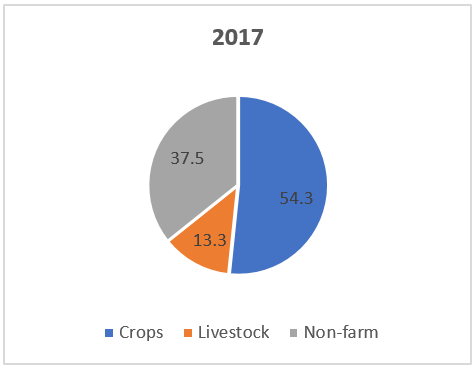
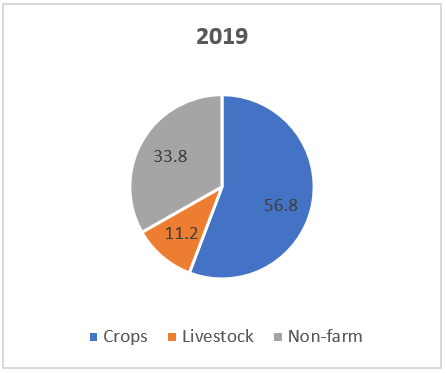
So, where did the decline in MPI, representing livelihood improvement, come from? The analysis shows that it came from enterprise diversification at the farm level, including other crops (bananas and cocoa), livestock and non-farm income, the last two accounting for over forty per cent of total household income (Figure 5).
Figure 5. Composition of total household income
Moreover, the analysis showed that livelihood improvement also depends on how a household spent the income they earned. The most livelihood improvement was recorded from households that spent their income to improve; sanitation, quality of house (floor), children’s education and electricity. The bottom line is, while income earned from rice commercialisation is important for poverty reduction it is only one income component, and how that income is spent is equally important. This means, while development efforts should strive to raise income, efforts should equally be directed at addressing factors that enable households to diversify as a risk management strategy. In addition, development agents should work with local communities to promote optimum and equitable use of income earned by families.
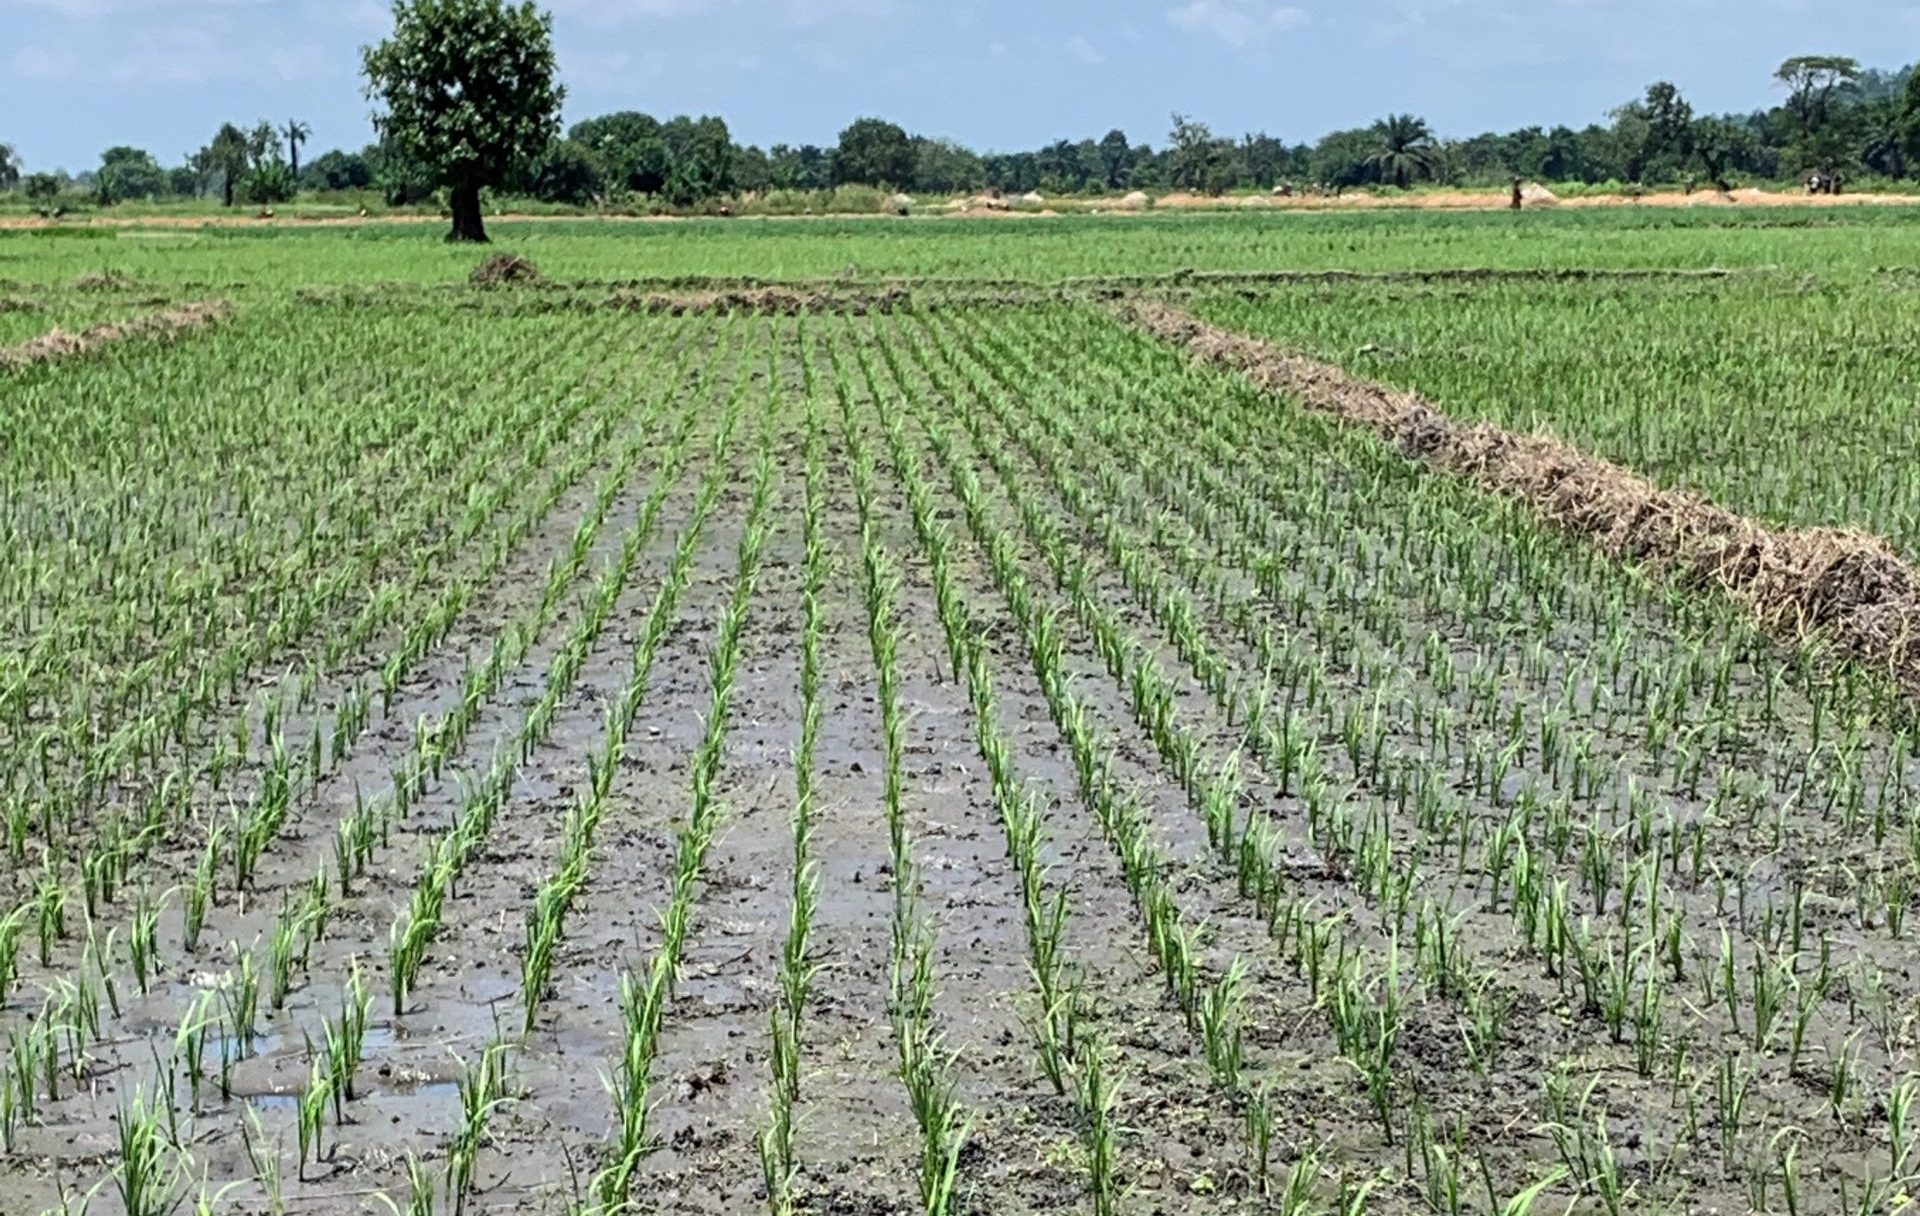
Figure 6. Photos representing intensification and extensification
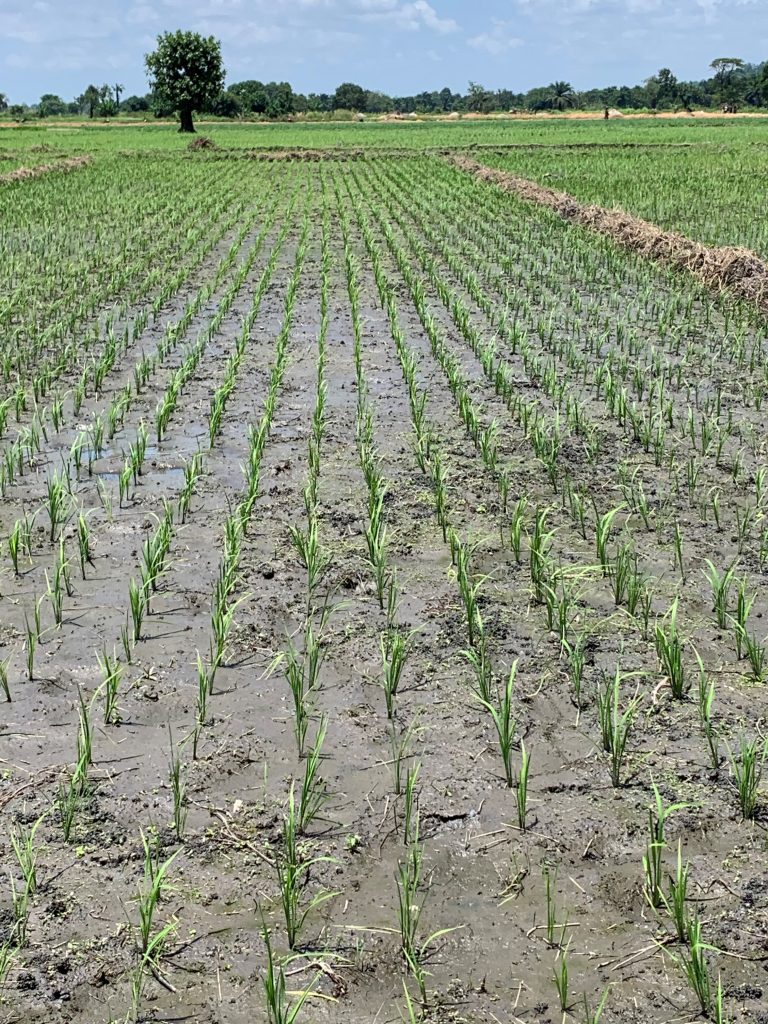
SRI for rice intensification 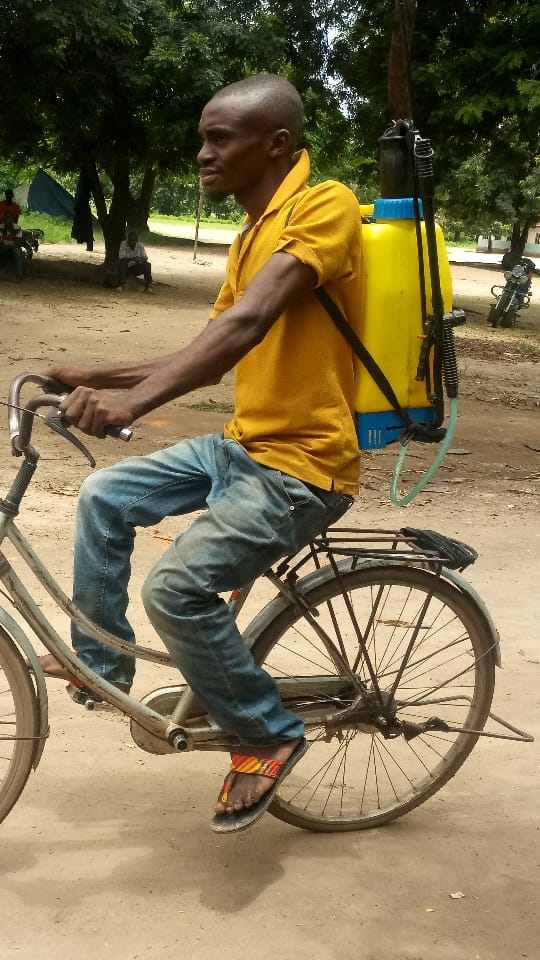
Sprayer rental services 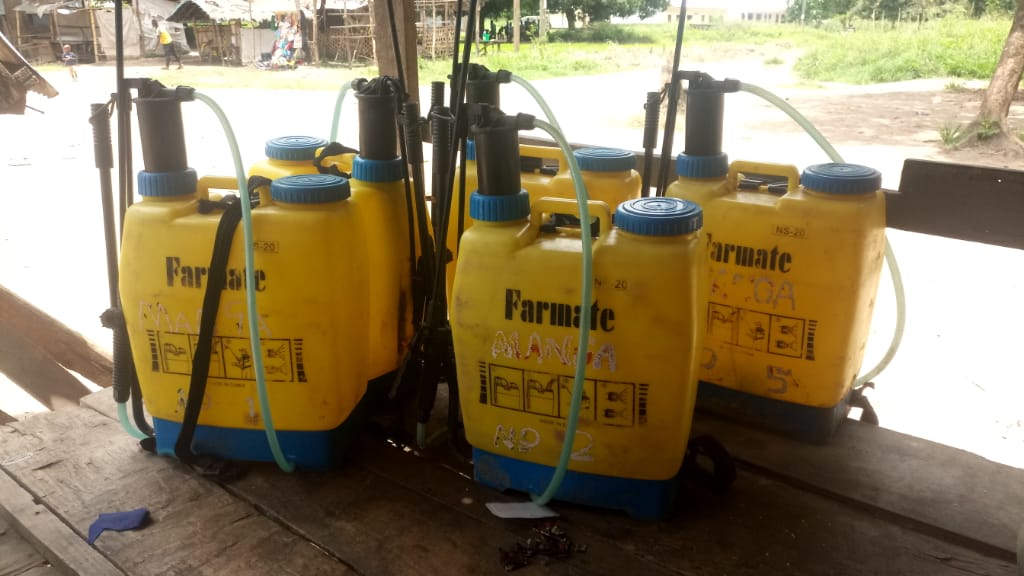
Spraying rental services 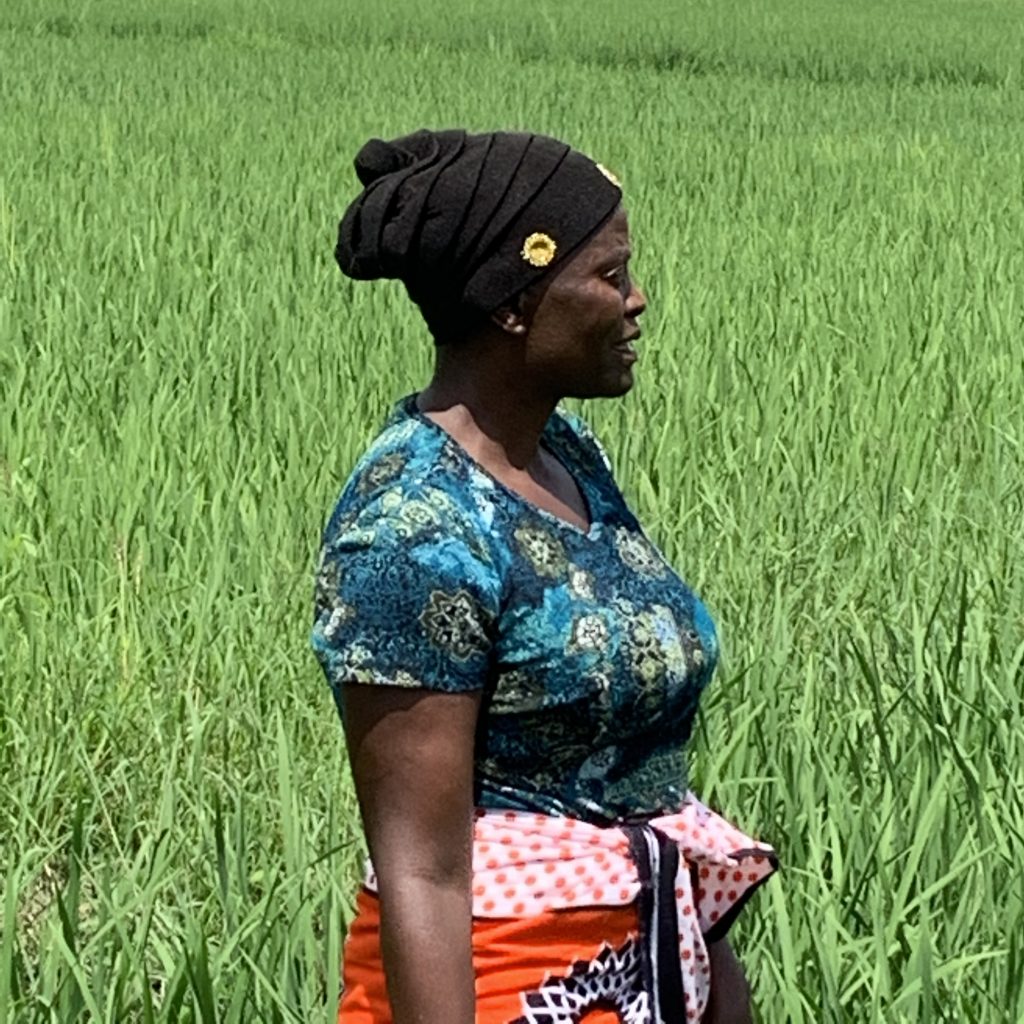
SRI for rice intensification 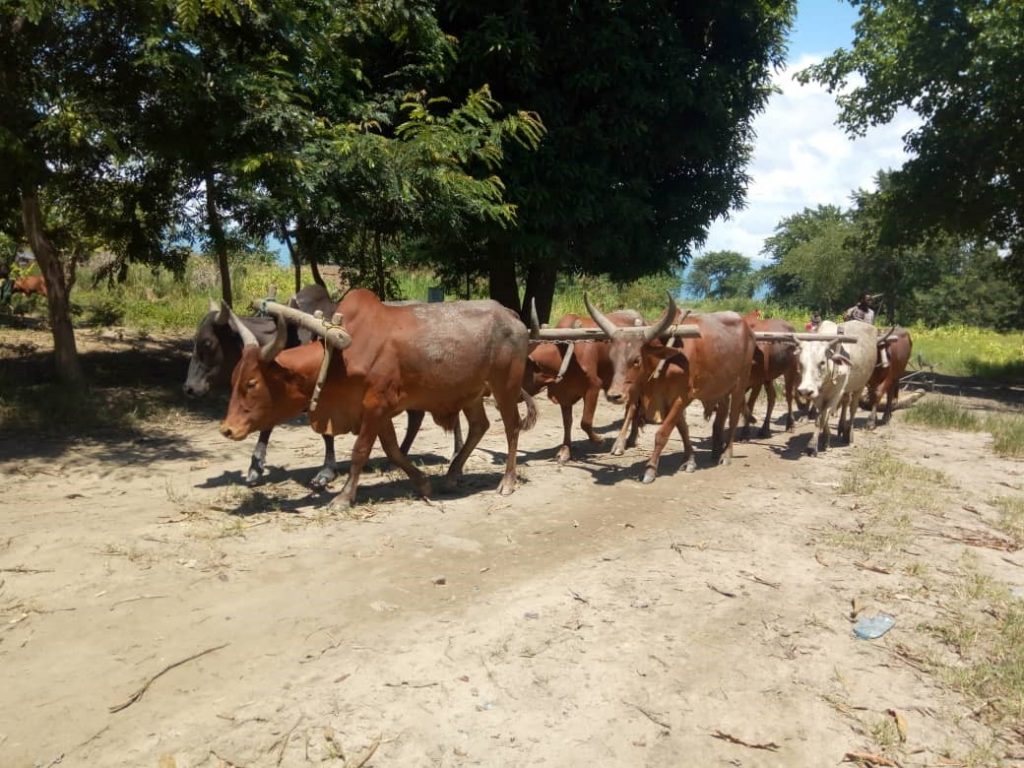
Oxen services for area expansion 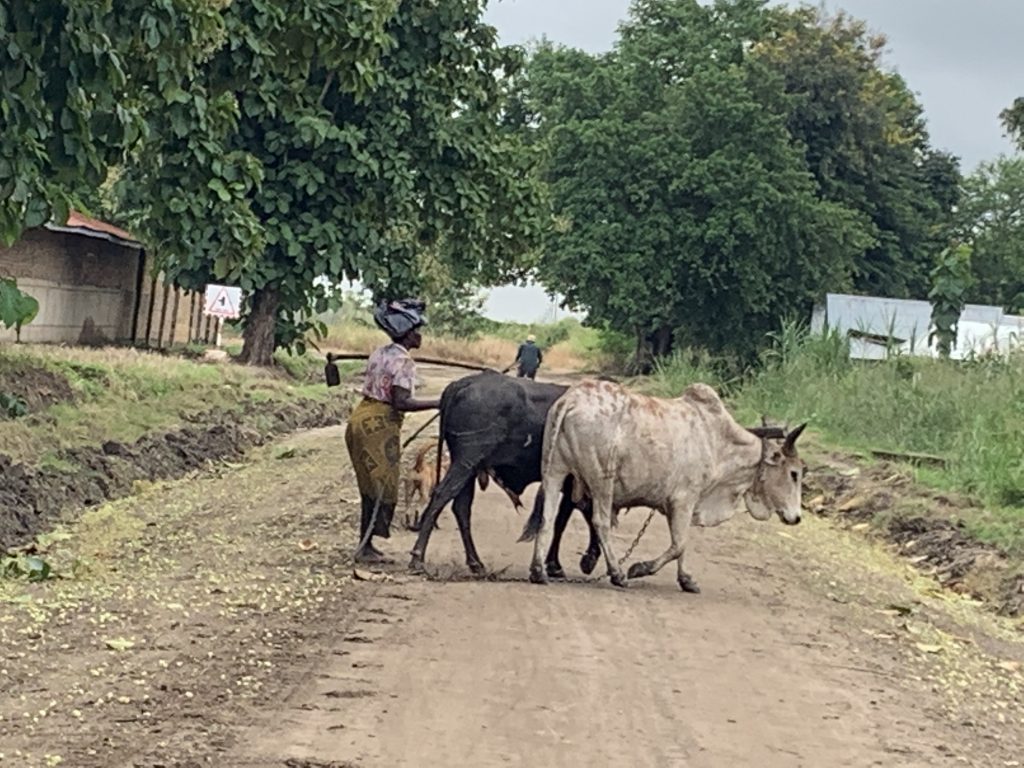
Woman leading oxen after day’s work