Streamlining data collection in sub-Saharan Africa
How can we efficiently and consistently collect household-level data that help examine pathways to agricultural commercialisation in empowering women, reducing rural poverty and improving food and nutrition security in sub-Saharan Africa?
In APRA, we found an answer to this question by adopting the World Bank-designed Computer Assisted Personal Interviewing (CAPI) platform, Survey Solutions. Throughout the entire process of design and data collection for the first round (of two) of the Work Stream 1 (WS1) panel studies in Ghana, Nigeria, Tanzania and Zimbabwe (more information on the APRA Work Streams can be found here), we were able to work together with other APRA team members, making use of remote monitoring for live updates during the survey and also interacting with team members in the field. For WS1 in APRA, we developed a detailed Data Management Plan to guide the design and the process of data collection. Working across the four countries, we found both flexibility and consistency in using Survey Solutions.
Questionnaire Design & Data Collection
We found that one of the key strengths of Survey Solutions was its flexibility in designing questionnaires. Using the software’s questionnaire designer, we were able to create one core survey questionnaire that included a common set of questions to address the APRA ‘Outcome Indicators,’ so that we could gather data on the key factors and processes shaping people’s access to different forms of agricultural commercialisation, and assess how those different pathways influenced their well-being. Ultimately, this will allow us to compare and contrast different trends, changes and differential outcomes across our focal countries. We also created country-specific versions of the survey, with additional questions. The ability to work on a
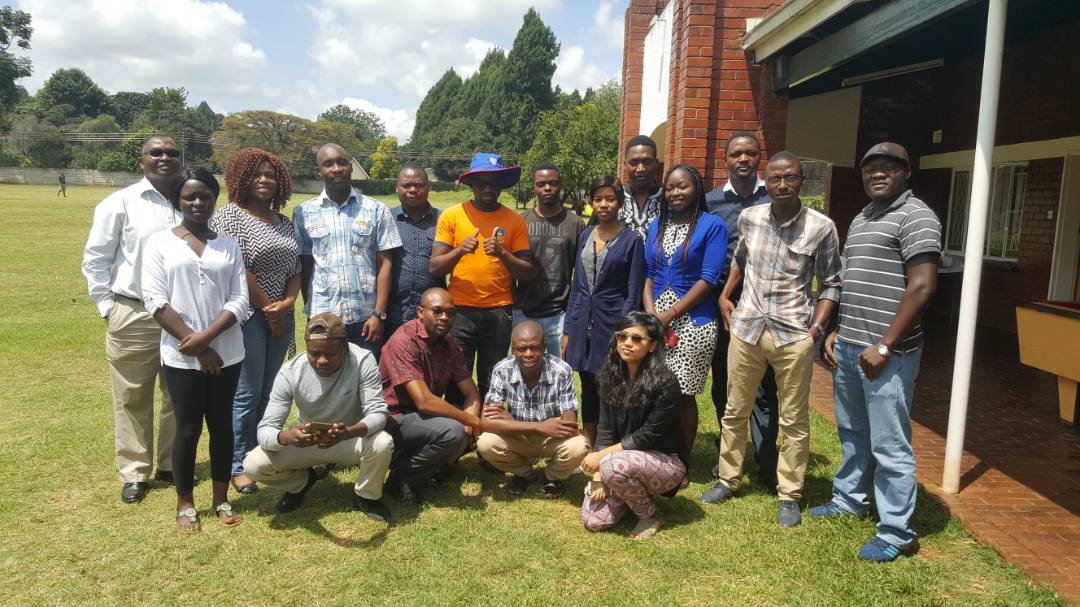
Training APRA survey team in Ghana
questionnaire simultaneously, with team members spread across sub-Saharan Africa and other parts of the world, ensured that we were able to incorporate key country-specific concerns without delay.
We collected various types of data on agricultural outcomes to measure commercialisation, using a comprehensive array of questions – such as number and size of plots; quantity of crop sold; etc. We also collected data on household characteristics (for example, occupants’ age, sex, occupation), listing each household member individually, to study links with commercialisation. GPS coordinates and time stamp data helped to record survey progress.
While basic questions in Survey Solutions do not necessarily require extensive knowledge of coding, using some of the more complex syntax based on C# programming language, we were able to embed a variety of checks within our surveys, to ensure that data entry was correct. These checks provided a ‘first layer’ of quality and consistency control in the survey.
We found that the Survey Solutions software combines functionality to capture data on tablets, with survey management tools and cloud data aggregation. A dedicated cloud-based server was set up for each country, with support from the World Bank’s Survey Solutions team. This server ensured continuous interaction with all APRA members involved in conducting surveys.
APRA Training & Monitoring
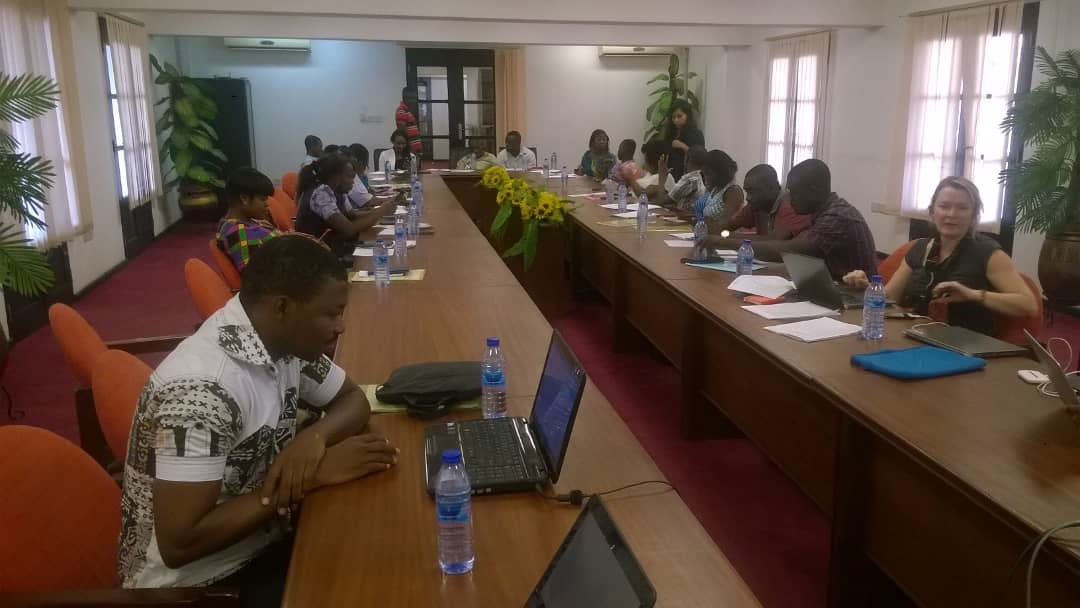
To train our teams in the use of the Survey Solutions software and the APRA questionnaire, we adopted a two-stage process, in which APRA team members involved in the survey design attended an intensive, week-long workshop at the World Bank headquarters in Washington, DC. All four country teams were then trained by the design team members. The training covered all functional elements of Survey Solutions. We cond

Survey in progress in Zimbabwe
ucted face-to-face training of the field teams in Ghana, Nigeria and Zimbabwe, while virtual training was provided to the APRA team in Tanzania. Training slides and material specifically applicable to APRA were developed in addition to those available from the World Bank to support the training.
We also found that Survey Solutions facilitated constant monitoring of survey progress and data quality checks – producing a summary for each survey, and flagging incomplete data or inconsistent answers to questions. This enabled the country research teams to detect and report data entry issues on an ongoing basis. Supervisors/headquarters (roles within survey solutions) could then reach out to enumerators to clarify these while other surveys are ongoing, thus providing a second layer of quality checks.
The Challenges
We did, however, face a few challenges in using CAPI. First, the use of a new survey software required additional time for training, learning and survey setup; second, the GPS functionality was not always straightforward to record in the field, but was immensely useful on completion; and third, there was a key concern regarding unreliable internet access, especially during training and data uploads.
The APRA Dashboard
The sophisticated tools for analysing household survey datasets are typically expensive and require a certain level of technical skill. Several APRA team members possess such expertise, but in our effort to ensure wider outreach and policy engagement, we have developed what we have called the ‘APRA Dashboard’. The idea for this application was born during our training and exchange with members at the Survey Solutions workshop. Built using the ‘application programming interface’ (API) functionality of the Survey Solutions software, the APRA dashboard consists of two elements: analysis and monitoring.
The ‘analysis’ function is based on flexible descriptive statistics and graphical presentation of data. Any user with basic knowledge of using applications can login and draw key diagnostics based on APRA household-level datasets. We will make use of the analysis function in Round 1 of WS1.
The ‘monitoring’ function is designed to add an additional layer of remote monitoring, to automate frequent checks for incoming data during surveys. Drawin
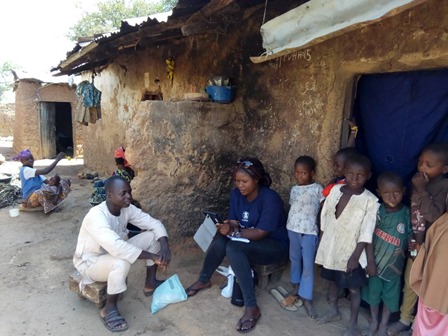
Survey in progress in Nigeria
g on the learning from our data collection and monitoring efforts during Round 1 of our WS1 panel studies, we have developed this new application. We will use the APRA Dashboard as an additional layer of remote monitoring in the second round of the survey. To capture the impact of using this API-based tool, we will compare the ‘para data’* generated by Survey Solutions, both before (Round 1) and after (Round 2) using this application.
Our APRA Dashboard aims to provide an easy-to-use interface that allows the analysis of household-level data without the need for complex software or technical skill. You can calculate descriptive statistics easily and generate graphs and tables quickly and accurately. We aim to provide the analysis element of the APRA Dashboard as an easy-to-use tool and a valuable resource for anyone interested in quick and informative descriptive analysis. Watch this space for further details.
* Para data includes timestamps for when the survey started and was completed; when the survey was sent and assigned to whom it was assigned; when it was received by supervisors; the time when questions were captured, etc.
Written by Amrita Saha
Image credits: Louis Hodey, Vine Mutyasira, Milu Muyanga